Your personal watchlist
Save companies you want to continue researching. Review charts and 12-month Wall Street analyst price-target estimates where available. Analyst estimates are third-party opinions—not Sage predictions.
Stock Sage scans major U.S. exchanges for companies that meet its fundamental qualification requirements and are trading near their own 52-week lows. The scan narrows the universe—it is not a recommendation to buy.
No Credit Card Required
Create your account, verify your email, then choose to activate your eligible 14-day free trial. One trial per customer, with all three products included.
One scheduled scan every Friday identifies companies on major U.S. exchanges that reached confirmed 52-week lows during the published market week and passed Stock Sage’s fundamental requirements.
Positive EPS in at least four of the previous five completed years, with total assets exceeding total liabilities in each of those five years. Compare company names, prices and five years of EPS together.
280 qualified stocks
Actual historical example · September 28–October 2, 2026. The number varies by week; qualification earns further research, not a purchase.
Stock Sage Results
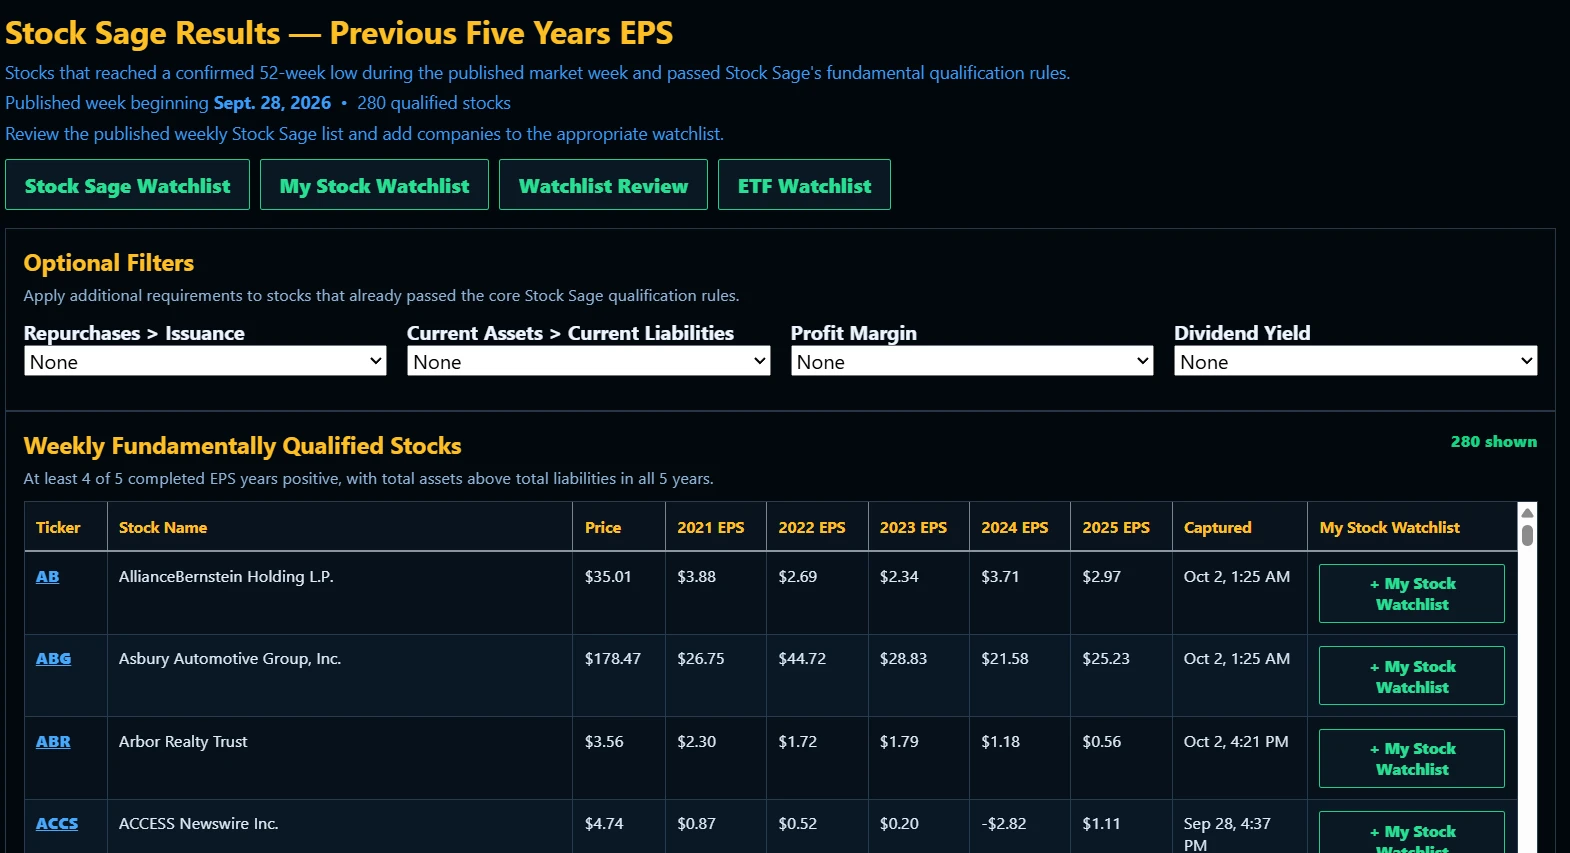
Results are incomplete while processing. Friday results reflect qualification at scan time; prices and company information can change afterward. A weekly scan does not imply immediate action.
Narrow the qualified-stock results with four optional filters: Stock Buybacks, Balance Sheet, Profit Margin and Dividend Yield.
Optional filters · 14 displayed
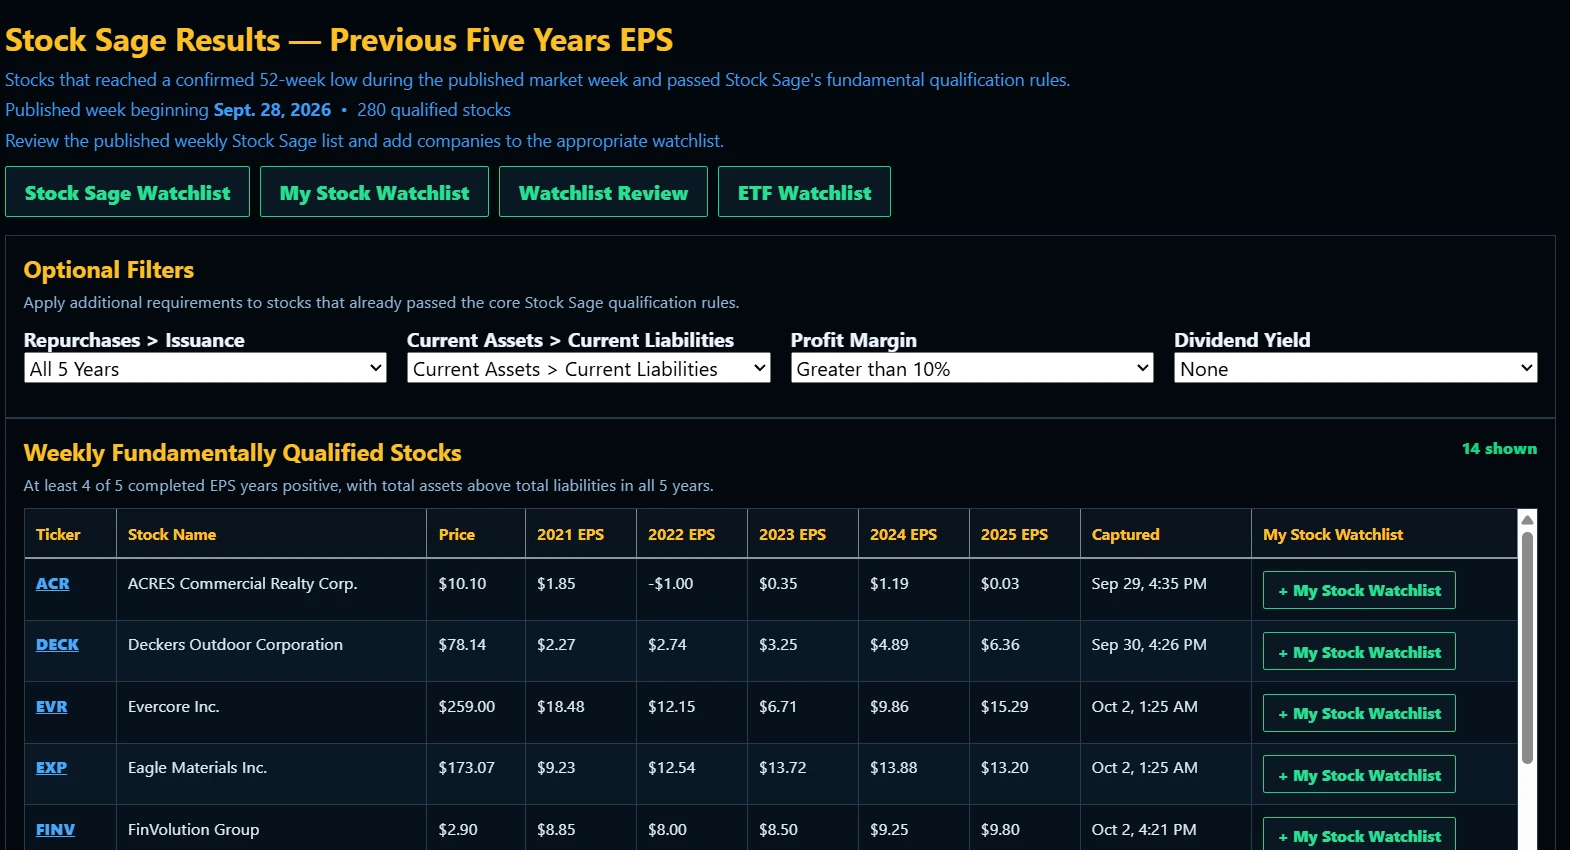
Historical market week September 28–October 2, 2026: one user’s additional filters narrowed the displayed list to 14. Results vary every week and are not typical or guaranteed. This is not a recommended filter combination. Optional filters do not generate the separate Weekly Top 5 Opportunities.
Independent dividend filter example
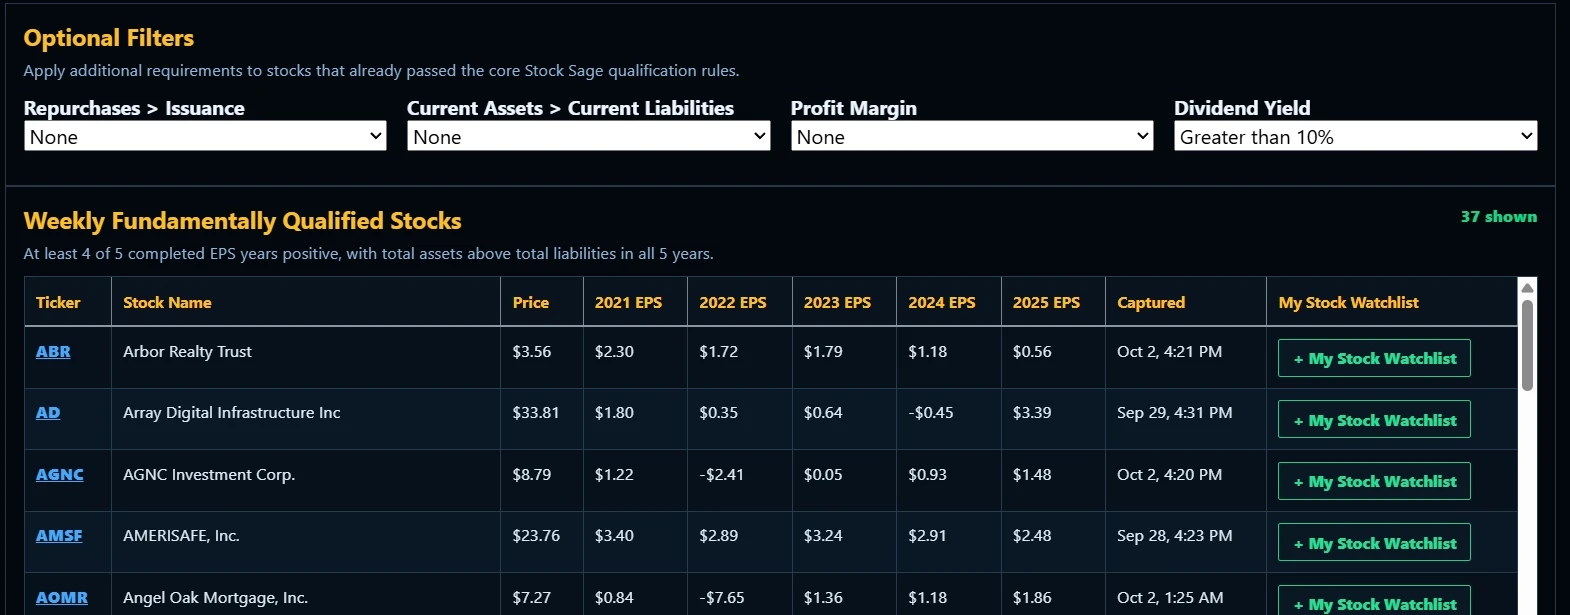
The dividend filter can be used independently. This historical example shows 37 results; a dividend yield alone does not establish investment quality or safety.
A separate weekly list of five companies drawn from financially qualified Stock Sage results and evaluated using additional company-quality and current research—not produced by your optional filters.
Weekly Top 5 Opportunities
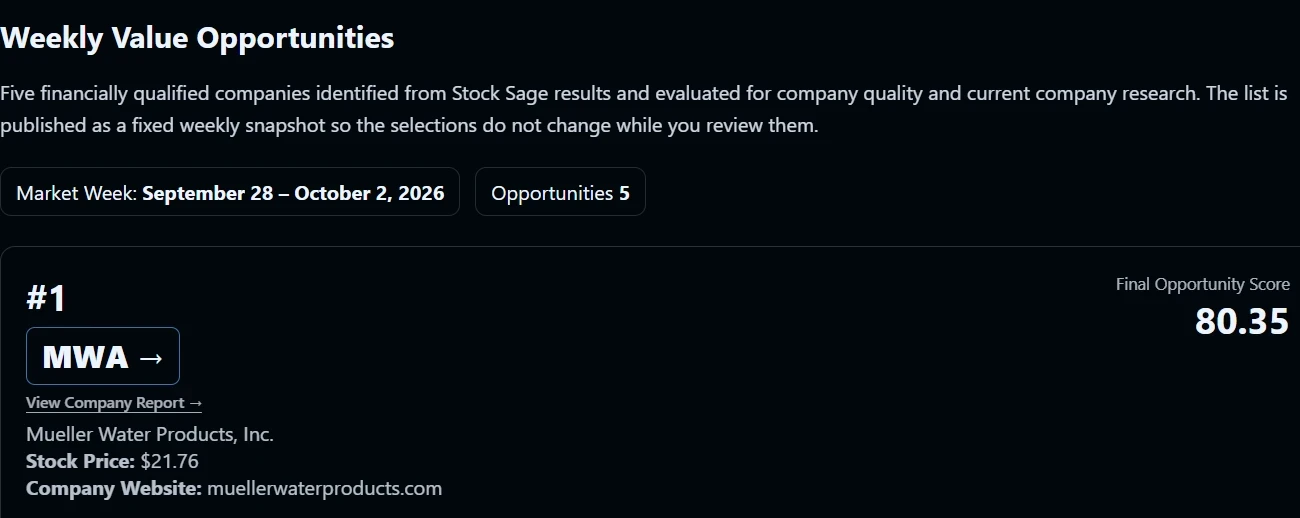
The application screenshot above shows the first-ranked company, MWA. The table presents the complete historical Weekly Top 5 rankings for the same period.
| Rank | Ticker | Opportunity Score |
|---|---|---|
| #1 | MWA | 80.35/100 |
| #2 | DECK | 79.50/100 |
| #3 | IBP | 77.30/100 |
| #4 | YELP | 70.81/100 |
| #5 | TME | 70.16/100 |
Historical information supplied by Sage Trading Suite — not a screenshot or live application output. Opportunity Scores are research evaluation scores out of 100, not stock prices, percentage gains or expected returns. A higher score indicates a stronger evaluation under Stock Sage’s research methodology; it does not guarantee price appreciation or establish that a stock should be purchased.
Review financial performance, historical profitability and return metrics, current company research, business outlook and potential risks. Selection explanations provide context for your own research, not instructions to buy.
September 28–October 2, 2026
Mueller Water Products (MWA) ranked first with an Opportunity Score of 80.35/100. This dated historical example is not a return forecast or investment recommendation.
Company research excerpt

No Credit Card Required
Create your account, verify your email, then choose to activate your eligible 14-day free trial. One trial per customer, with all three products included.
A company report brings supported historical and current fundamental information together, so you can evaluate quality, financial condition, valuation, and cash generation before making your own decision.
A stock trading near its 52-week low is not automatically an attractive investment. Company reports help you examine the business behind the ticker.
DECK · Company report
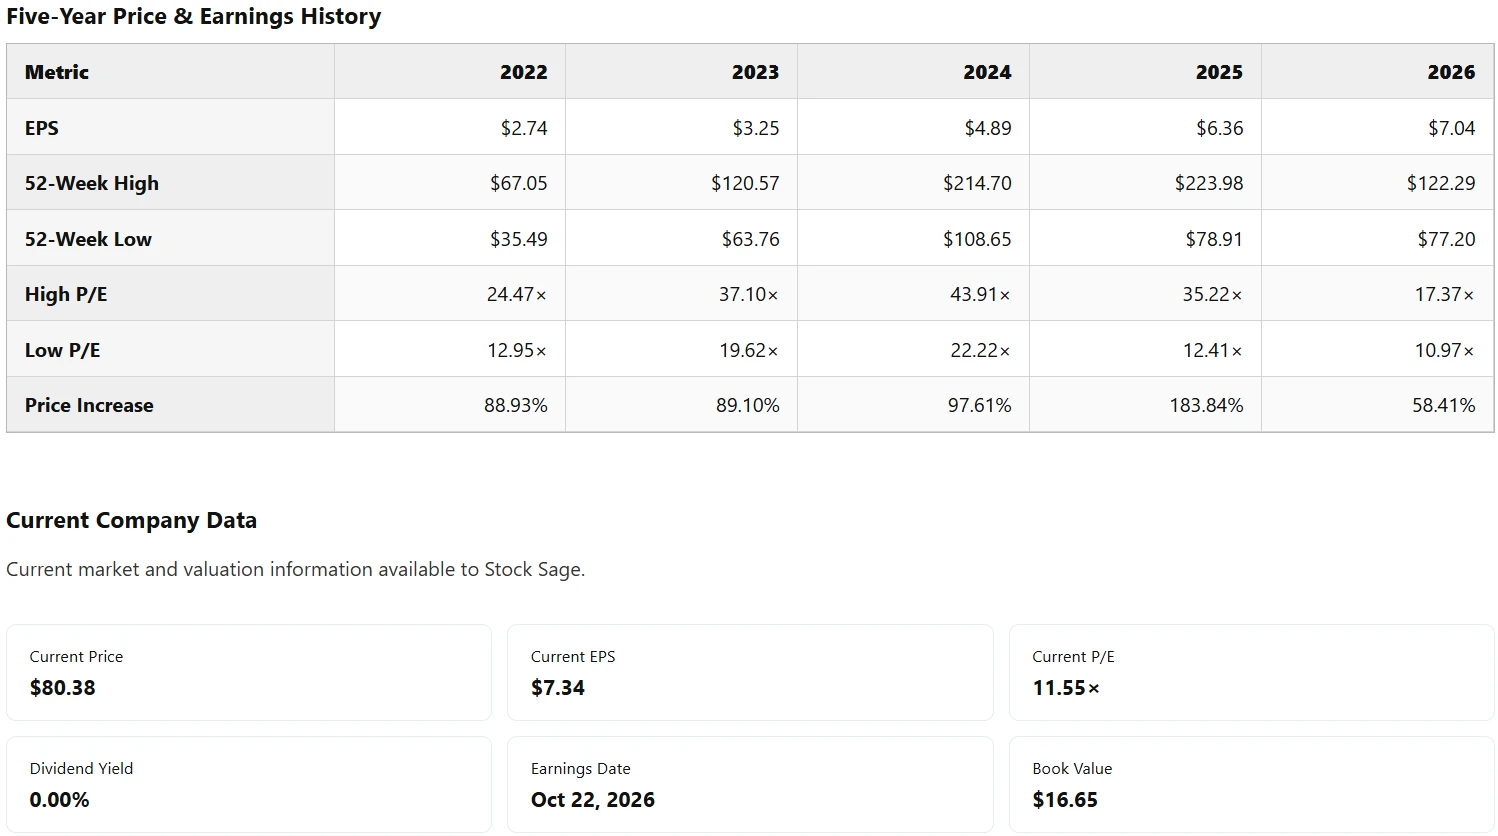
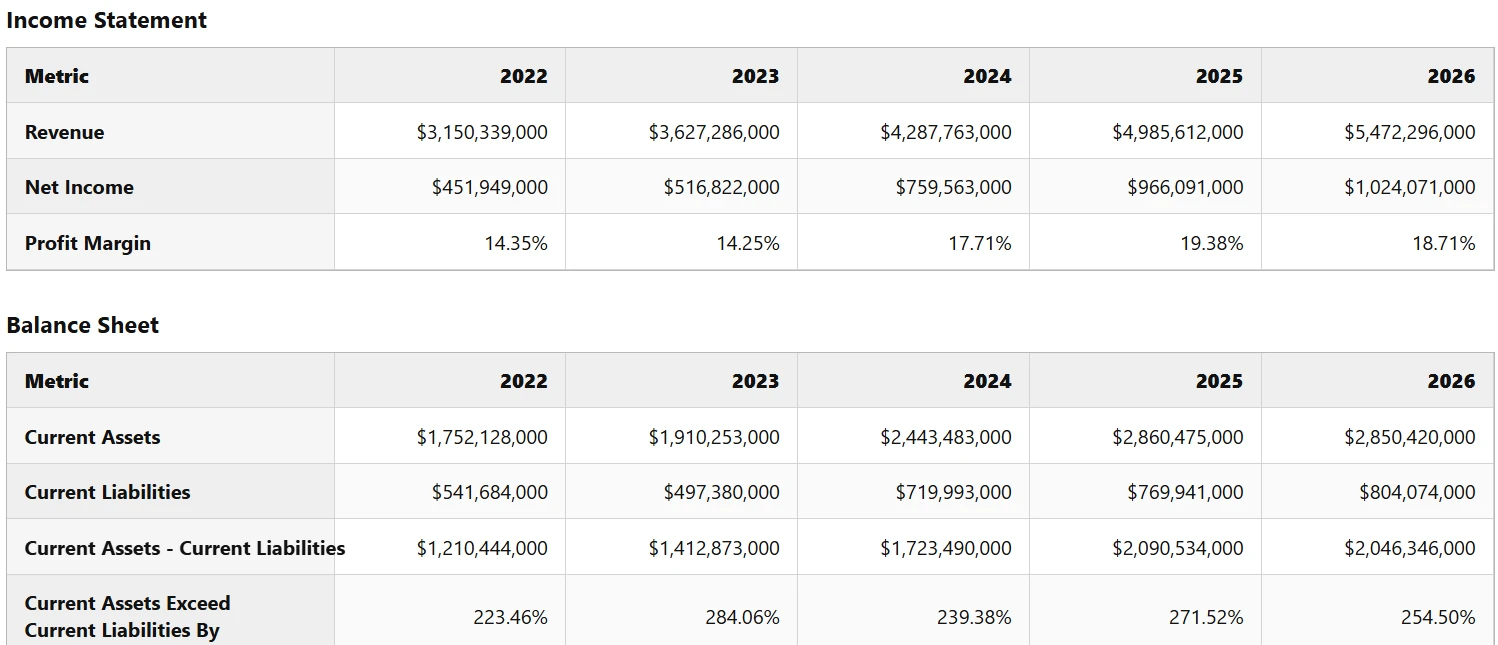
DECK · Income statement and balance sheet
DECK · Cash flow statement
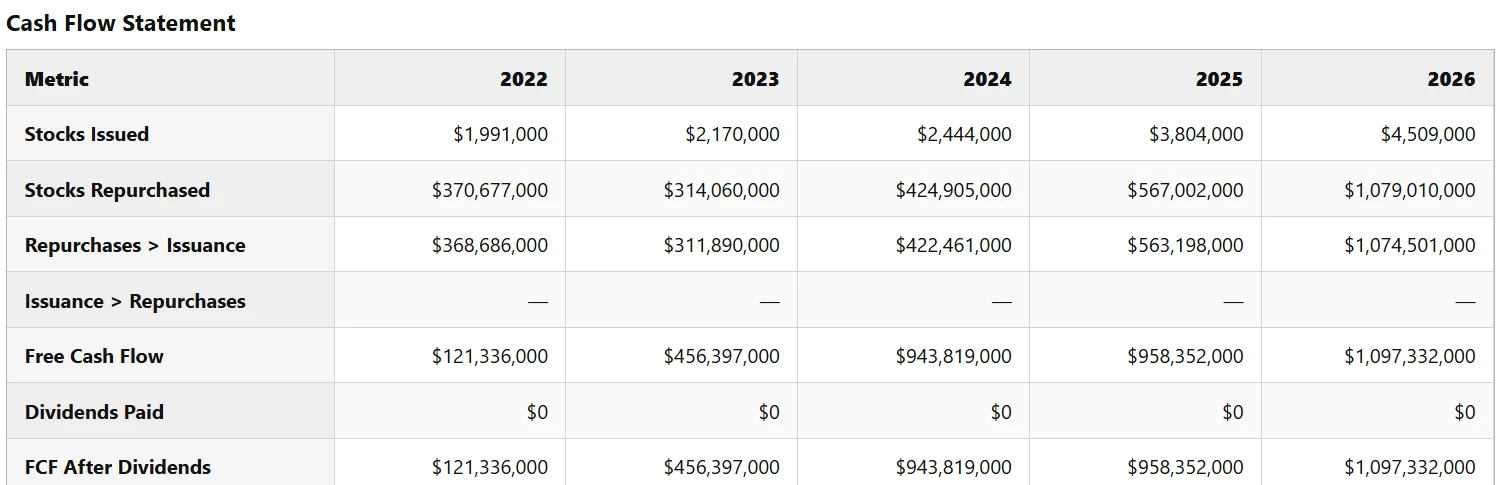
Actual DECK report screenshots captured October 8, 2026. Financial tables are research inputs; read their labels and periods carefully, and consider the company’s condition alongside valuation and risks.
Compare the current market price with an average 12-month analyst price estimate, where available, while considering financial condition and other research.
Historical example · October 8, 2026 · not current market prices
Analyst estimates provide another reference point for evaluating a stock's current price. They are opinions about possible future prices, not guarantees that a stock will reach those values.
Watchlist · Analyst estimates
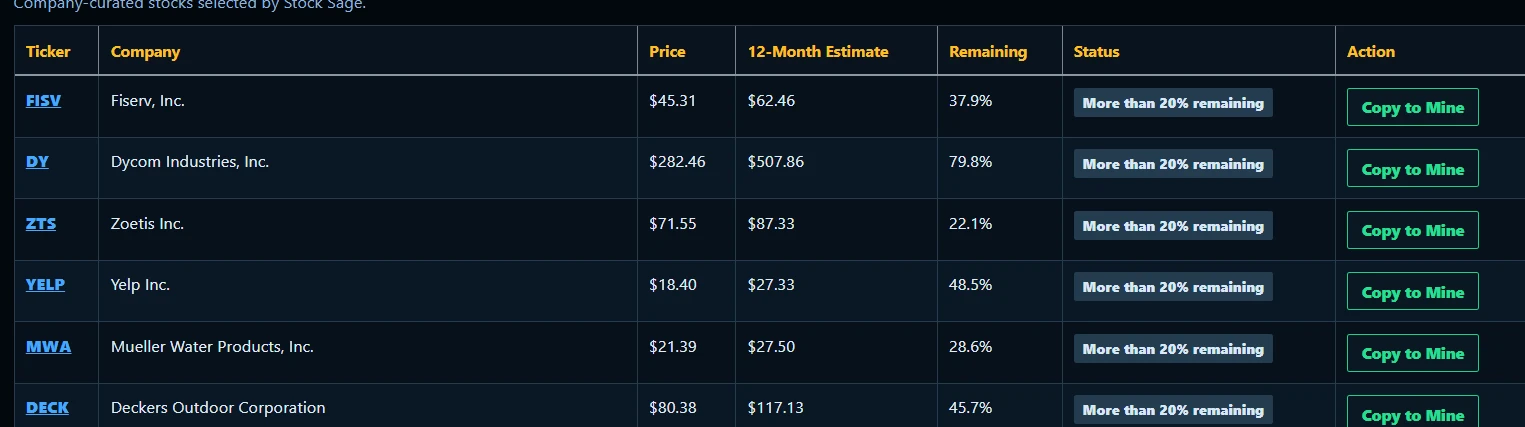
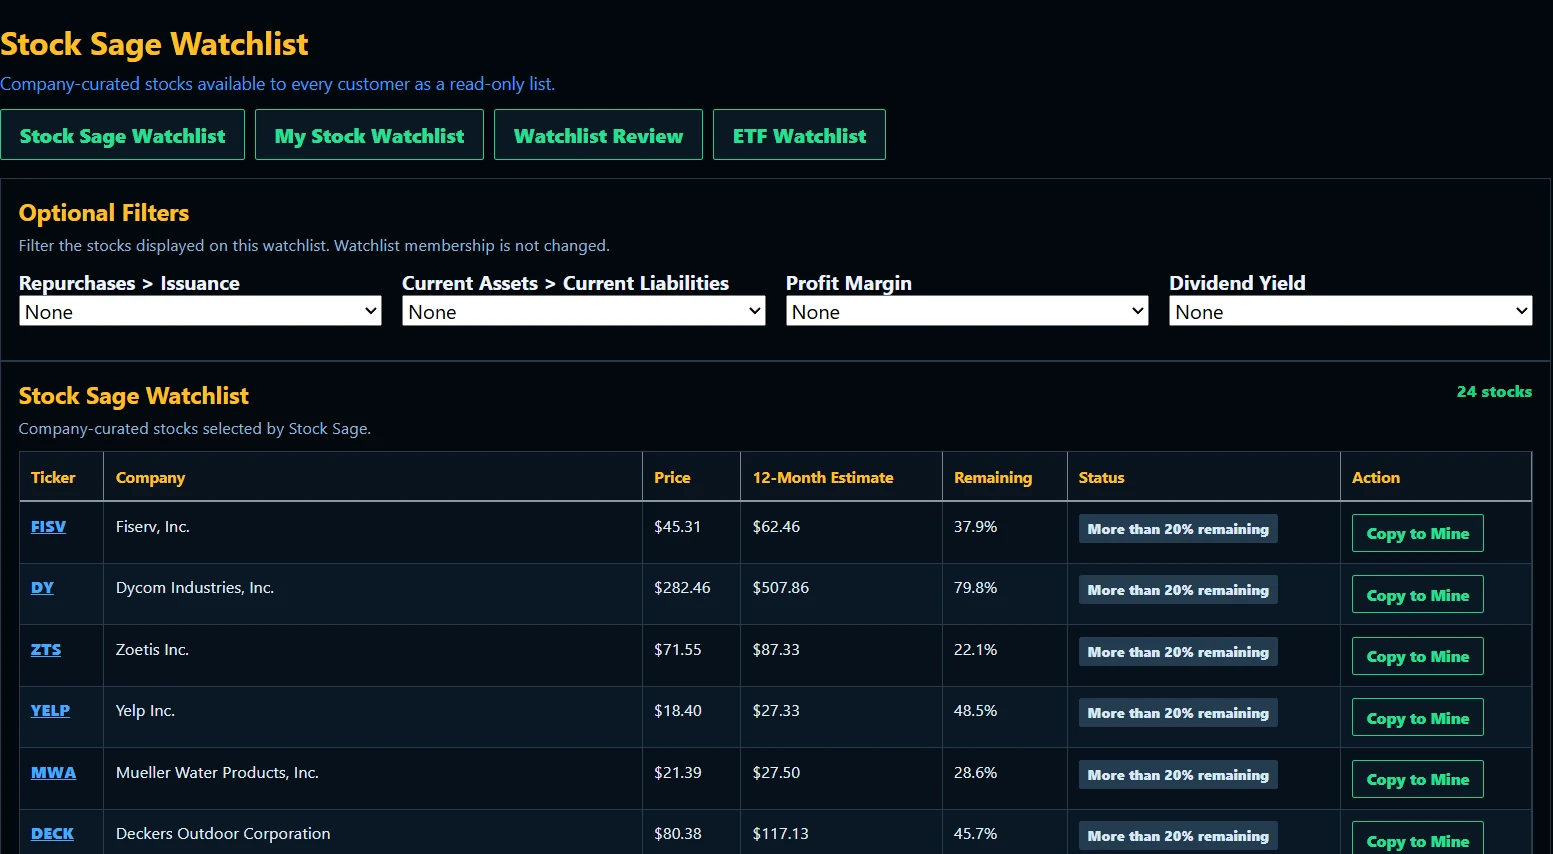
Historical values captured October 8, 2026—not live prices. Watchlists show prices, available estimates and the percentage remaining for comparison. Analyst estimates are third-party opinions, not a guaranteed future price, guaranteed return or Sage Trading Suite prediction.
Sage Trading Suite helps you interpret available financial and market information in understandable language—especially helpful when financial terms and technical indicators are unfamiliar.
Understand research findings without having to interpret every technical term.
Listen to supported explanations through your browser's speech functionality.
Plain English · Read Aloud
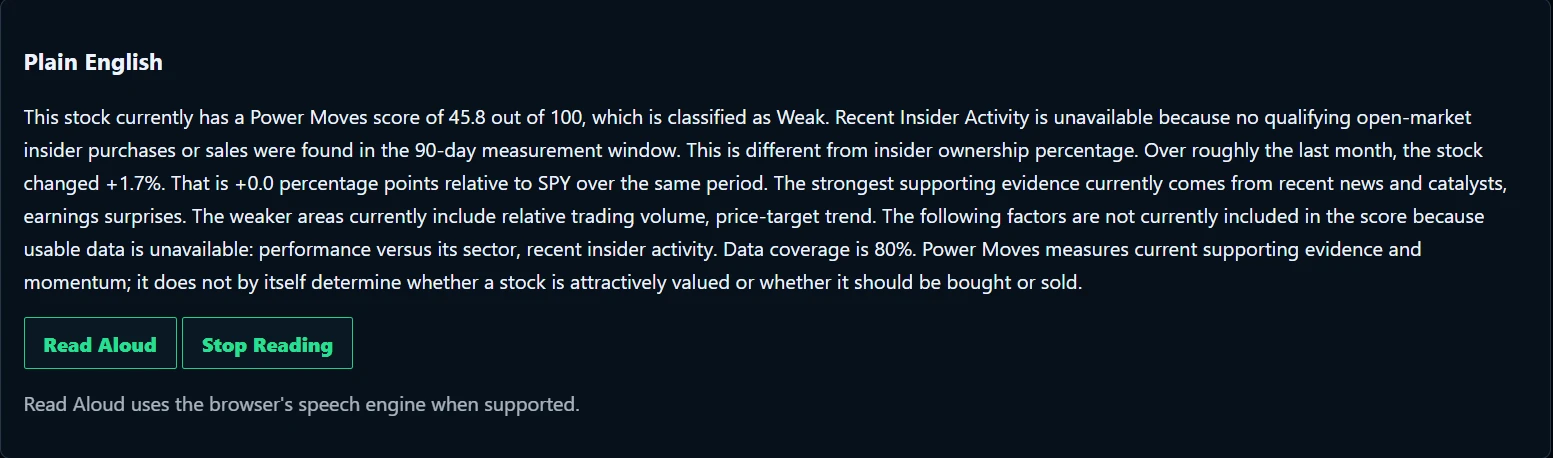
The Power Moves explanation discusses recent performance, strength relative to market benchmarks, supporting evidence, weaknesses and data availability. Confidence and coverage help you see the limitations—not just the score.
Read Aloud plays the written Plain English analysis, when supported; Stop Reading ends playback. It is not a conversational financial adviser, a personalized voice conversation or a spoken investment recommendation.
No Credit Card Required
Create your account, verify your email, then choose to activate your eligible 14-day free trial. One trial per customer, with all three products included.
Save companies you want to continue researching. Review charts and 12-month Wall Street analyst price-target estimates where available. Analyst estimates are third-party opinions—not Sage predictions.
Review research ideas curated through an approach developed over approximately 25 years of stock analysis. These are ideas for your own research, not instructions to buy.
Compare prices and available 12-month estimates, then keep the companies you want to research within reach. Copy eligible companies from the Stock Sage Watchlist to your personal watchlist.
View only
A company-curated list that customers can view but cannot modify. Copy eligible companies to your own watchlist with Copy to Mine.
Stock Sage Watchlist
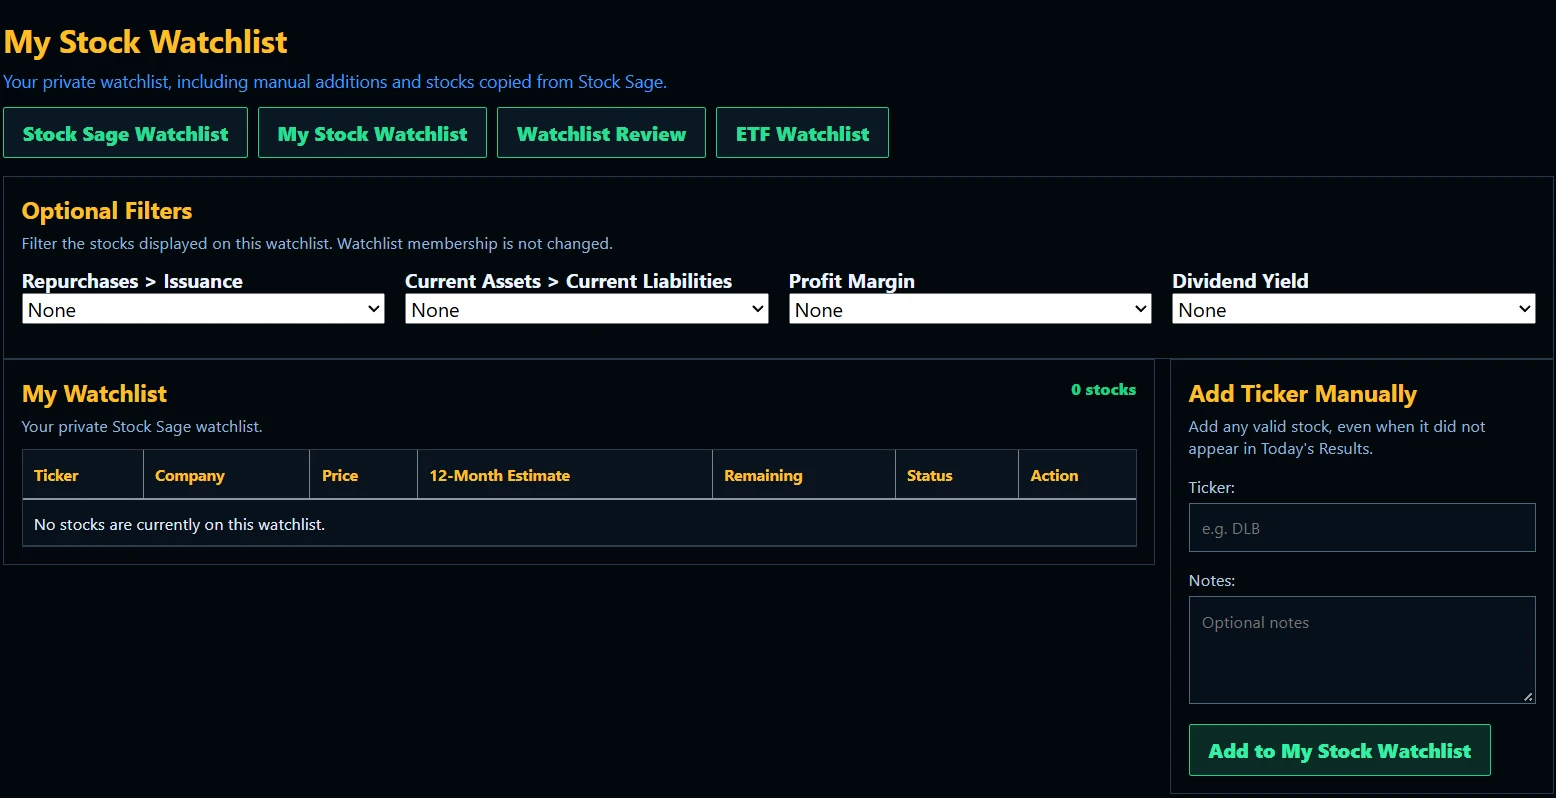
Yours to edit
A personal list where you save and organize the companies you want to research—add tickers manually or copy them from the Stock Sage Watchlist.
My Stock Watchlist
Charts help you study historical price behavior and trends—they do not predict future prices with certainty.
DECK · Candlestick chart
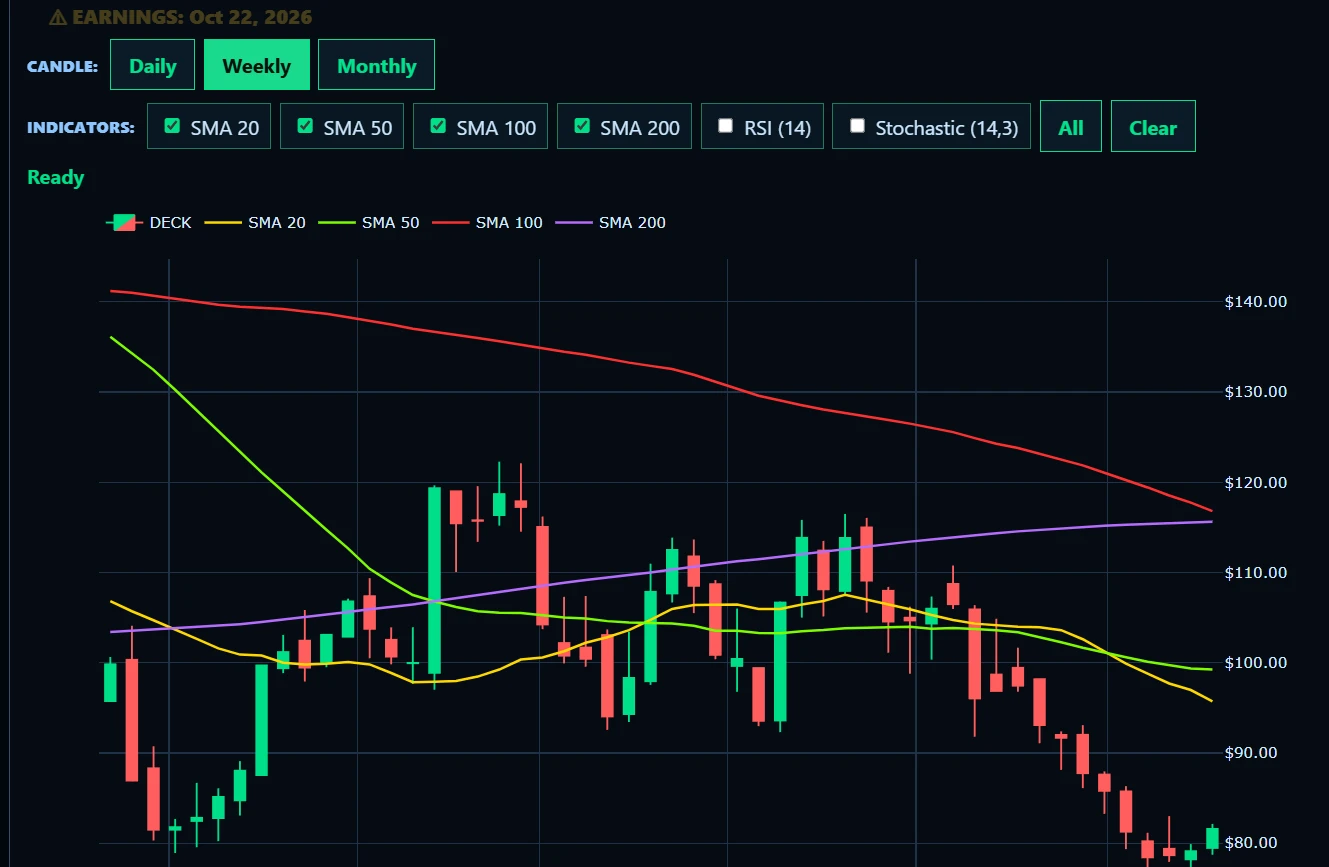
Browse a watchlist or enter a stock ticker or company name in Individual Stock / ETF Lookup, then load the available chart. Research holdings, ideas from others or new companies. Company research is available where supported; complete coverage is not guaranteed for every ticker.
Individual Stock / ETF Lookup

Charts describe historical price behavior; they do not predict the future or establish an entry or exit decision.
Finding a quality company at a low price is only the beginning. Power Moves helps prioritize supported evidence that market strength may be improving.
Review current price behavior and supported strength measures.
Organize available catalysts, analyst activity, insider activity, and other supported factors.
Rank the evidence across watched stocks so further research is more focused.
Power Moves does not prove institutional accumulation and is not a guaranteed buy signal.
Power Moves provides a separate assessment of current market strength and supporting evidence, helping you examine momentum, relative performance, catalysts and other available indicators. It does not establish whether a stock is undervalued or guarantee that its price will rise.
DECK · Power Moves summary

October 8, 2026 historical DECK example: Power Score 45.8/100, Weak rating, Moderate confidence and 80% data coverage. These are current-evidence summaries at that time—not probabilities, investment returns or recommendations.
Power Moves · Watchlist ranking
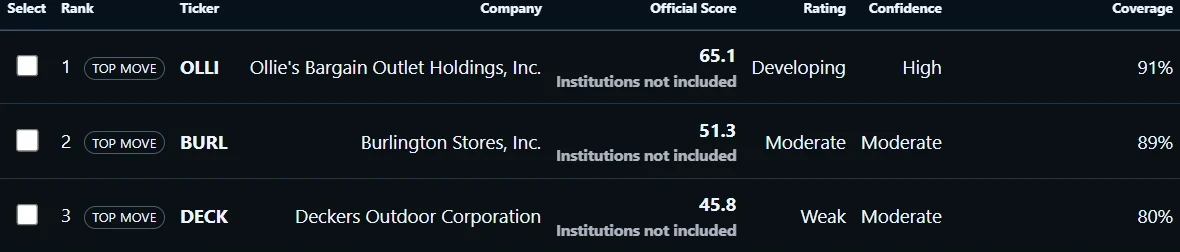
Historical ranking example: OLLI 65.1/100, BURL 51.3/100, DECK 45.8/100. Power Scores are out of 100—not stock prices, returns or probabilities.
No Credit Card Required
Create your account, verify your email, then choose to activate your eligible 14-day free trial. One trial per customer, with all three products included.
Sage Trading Suite provides analysis and educational information. It does not place trades or provide individualized investment advice. Trading and investing involve risk, including possible loss of principal.